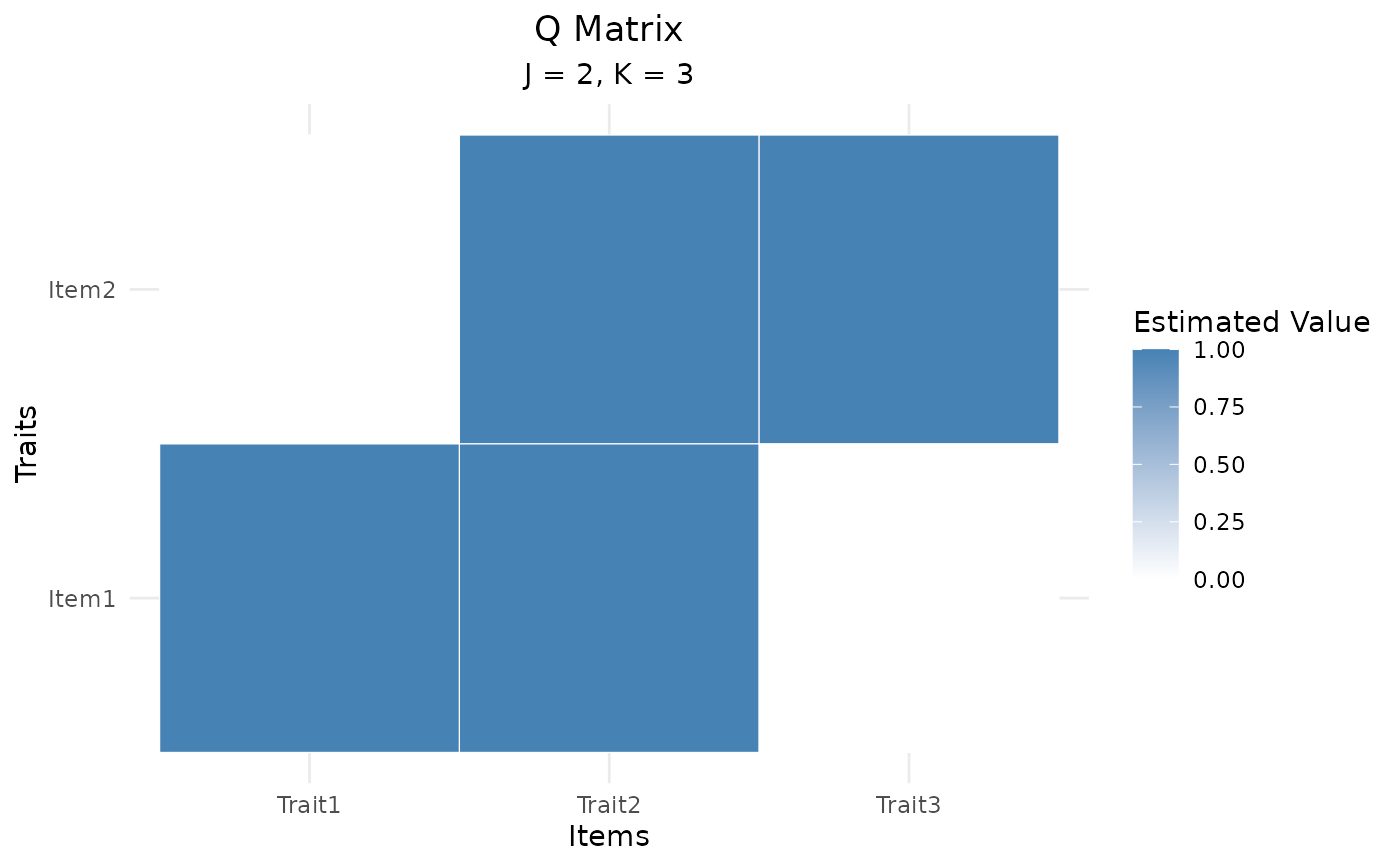
Provides a heatmap approach to showing the estimated binary or averaged values of the Q Matrix.
q_graph(x, ...)

# S3 method for class 'auto_edina'
q_graph(x, binary = TRUE, ic = c("ppp", "bic", "dic"), ...)

# S3 method for class 'edina'
q_graph(x, binary = TRUE, ...)

# S3 method for class 'matrix'
q_graph(x, ...)

# S3 method for class 'q_matrix'
q_graph(x, ...)
Arguments
Value
A ggplot2 object with a heatmap overview of the estimated Q matrix.